
Two Main Types: Plug-Level and Whole-Home
Energy monitoring devices fall into two broad categories, and understanding the difference shapes how useful they are for any given goal.
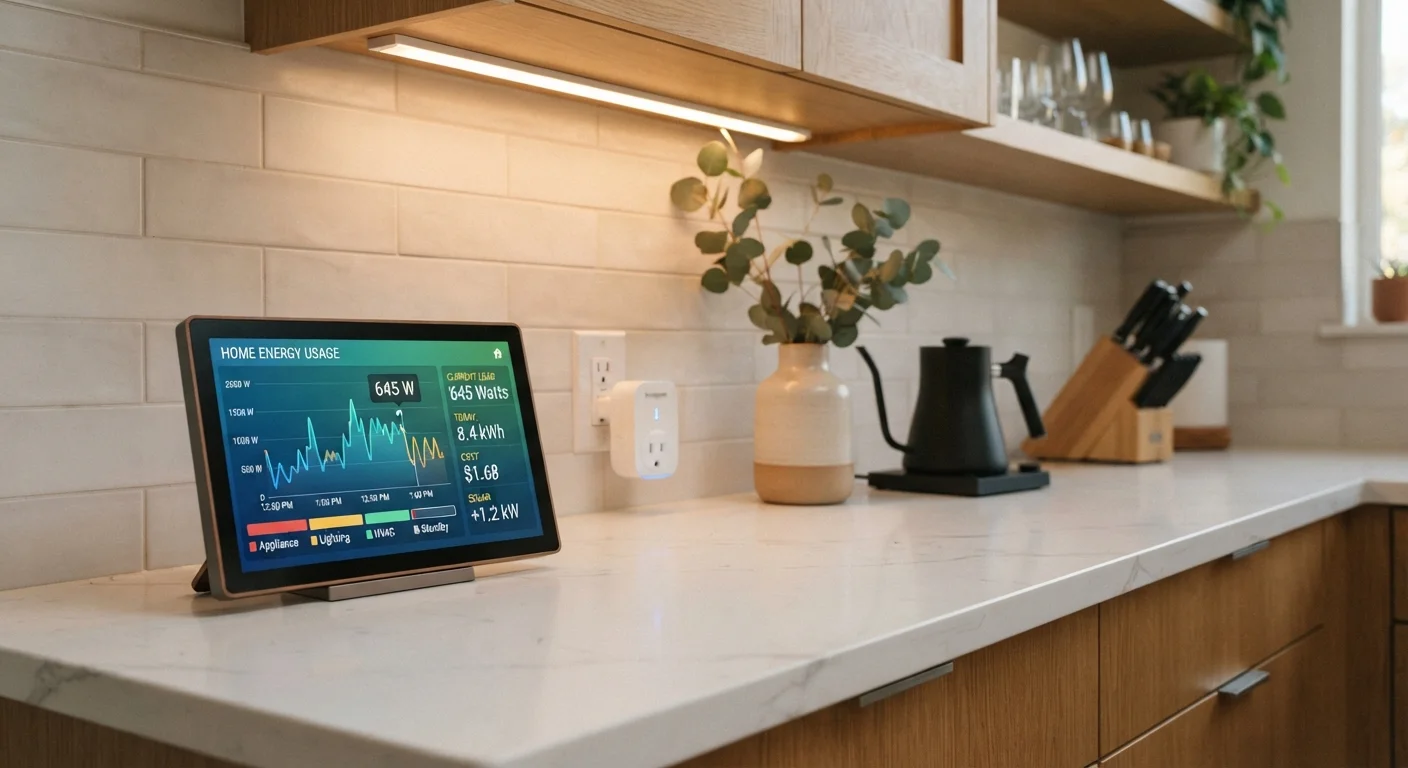
Plug-level monitors are small adapters that sit between an appliance's power cord and the wall outlet. They measure the draw of that single device - a refrigerator, space heater, gaming console, or anything else plugged into them. They are straightforward to use, require no installation expertise, and give precise data about one appliance at a time.
Whole-home monitors attach to the electrical panel and measure consumption across all circuits simultaneously. Higher-end models use load disaggregation - software analysis of power signatures - to estimate which appliances account for which portions of the total load, even without individual sensors on each device. These systems provide a comprehensive view of household consumption patterns over time.
For households wanting to understand one suspicious appliance, a plug-level device is usually sufficient. For a full picture of where electricity goes throughout the home, a whole-home system delivers more actionable insight. See our room-by-room breakdown of home technology for context on where monitoring tends to deliver the most value.
5-10%
Typical share of home electricity from standby loads
The U.S. Department of Energy has estimated that standby power - devices drawing electricity while not actively in use - accounts for roughly 5-10% of residential electricity consumption.
~$150/yr
Estimated annual standby power cost per household
The Lawrence Berkeley National Laboratory has estimated that standby power costs the average U.S. household approximately $100-$200 per year, depending on the number and type of connected devices.
25-30%
Heating and cooling share of home energy use
According to the U.S. Energy Information Administration, space heating and cooling typically represent the largest single category of residential energy consumption.
What the Data Actually Shows
The core metrics energy monitors report are consistent across device types: instantaneous power draw (watts), cumulative consumption (kilowatt-hours), and estimated cost based on a utility rate you input. Most companion apps present this as real-time readings, hourly charts, daily summaries, and monthly trends.
Three patterns routinely stand out when households start reviewing this data:
- Standby drain: Devices left plugged in but not actively in use - televisions, entertainment systems, older appliances - often draw continuous low-level power that accumulates significantly over a month.
- Peak-hour concentration: Households frequently discover that a large share of their daily consumption happens in short windows - typically morning and evening - which matters in areas with time-of-use utility pricing.
- Aging appliance inefficiency: An older refrigerator or HVAC unit running longer cycles than expected can show up clearly in the data, signaling that the equipment is working harder than it should.
Start with the Appliances You Suspect Most
Rather than trying to monitor every device at once, begin by testing the appliances you suspect are using the most energy - older refrigerators, electric water heaters, window AC units, and home office equipment are common culprits. A single plug-level monitor rotated through these devices over a few weeks can generate a clear priority list without requiring a whole-home system.
This kind of data is comparable in concept to how other tracking tools work across domains - for instance, fitness trackers measure physical activity patterns but only drive change when users interpret and respond to the readings.
How Households Put the Data to Use
Raw numbers become useful only when they inform a decision or change a behavior. The most common practical applications fall into a few categories.
Identifying and eliminating waste is the most immediate use. Seeing that a rarely-used second refrigerator in a garage draws as much power as several other appliances combined often prompts households to consolidate. Similarly, discovering that a gaming console in standby mode draws 15-20 watts continuously is the kind of concrete data that motivates using a smart power strip or adjusting settings.
Validating efficiency upgrades is another high-value application. After replacing an old appliance or adding insulation, energy data provides an objective before-and-after comparison rather than relying on estimated savings from marketing materials. Our companion article on energy efficiency upgrades that move the needle on utility bills goes deeper on which improvements have documented impact.
Integration with smart home systems extends what monitoring data can trigger. When a monitor is connected to a broader home platform, consumption spikes or scheduled events can initiate automations - shifting high-draw tasks to off-peak hours, for example. Understanding how smart home ecosystems connect devices helps clarify where energy monitors fit within a larger setup.
Utility Smart Meters Are Not the Same Thing
Many homes now have utility-installed smart meters that transmit usage data to the utility company for billing. While some utilities offer consumer-facing portals showing this data, smart meters are not the same as consumer energy monitors - they typically show total daily or hourly consumption rather than real-time or appliance-level detail. Consumer monitors and utility smart meters serve different purposes and can complement each other.
It is worth noting that energy monitors provide information - the behavioral or mechanical changes that reduce consumption still depend on the household acting on what the data reveals.