
What Price Trackers Actually Record
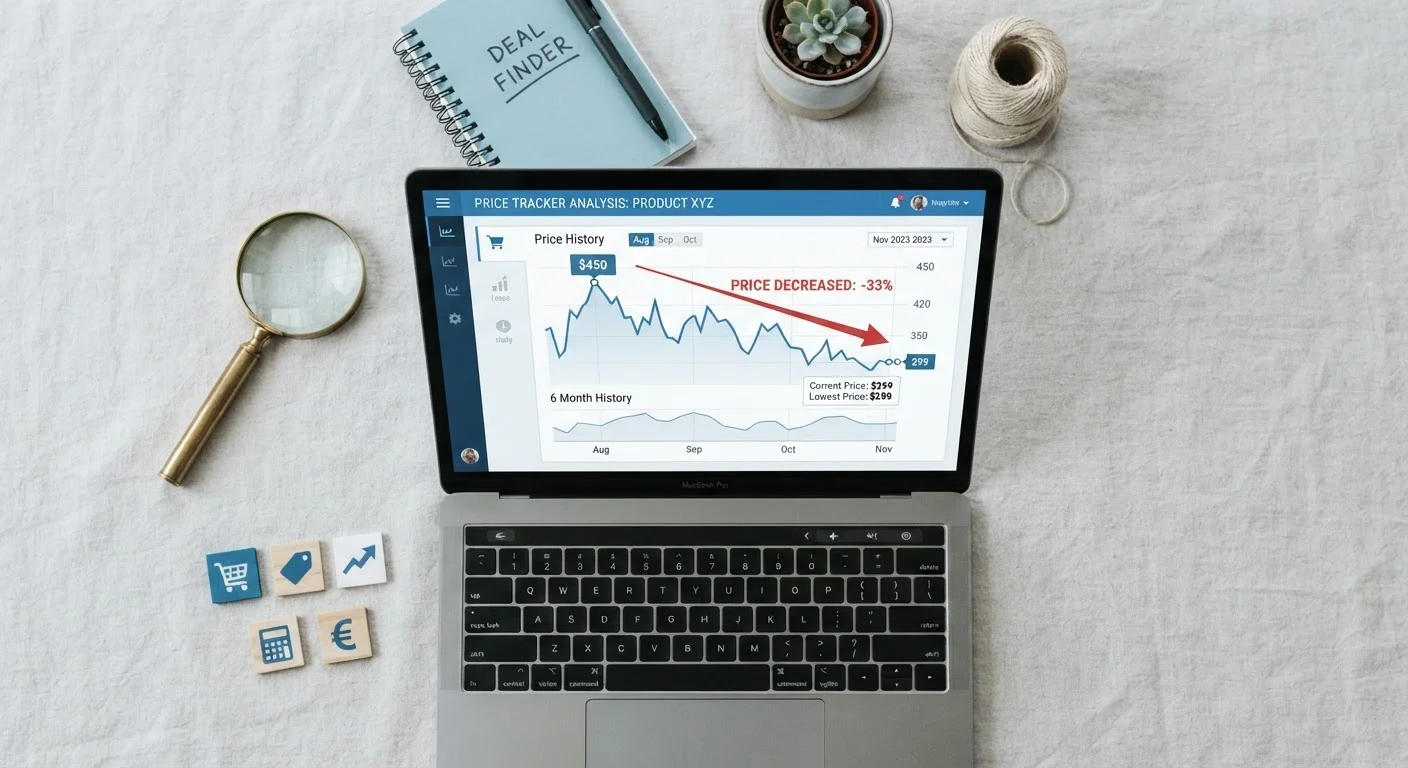
Price tracking tools do one core job: they log the listed price of a specific product URL at a given retailer on a recurring basis. That data gets plotted into a chart showing price over time. What this means in practice is that you can look at a product and see whether a current sale price is genuinely unusual - or whether the item routinely sells at that level.
What trackers do not record by default is equally important to understand. They capture the listed retail price, not the effective price after coupons, loyalty discounts, credit card cashback offers, or bundled promotions. A product sitting at a nominally higher price may in fact be cheaper for a shopper who stacks a promo code - and the tracker won't show that. For a broader toolkit on evaluating real per-unit value, see our guide to unit pricing math.
~daily
Typical price crawl frequency for major retailers
Most established price tracking services update product prices once every 24 hours on average, though some check more frequently for high-traffic items.
Up to 90 days
Common free price history window
Many free-tier tracking tools cap historical data at 90 days; longer histories - often needed to spot seasonal patterns - may require a paid tier or a different service.
How the Data Is Collected - and Where Gaps Appear
Most price tracking services use automated crawlers that visit product pages on a schedule - often every few hours or once daily, depending on the tool and the retailer. When the crawler visits, it reads the displayed price and logs it. This means prices that change and revert within a short window may never be captured, creating gaps in the historical record.
A second source of distortion is seller mixing. On marketplace platforms, a single product page may aggregate prices from the retailer itself and dozens of third-party sellers. Some trackers average these or display the lowest available price regardless of seller reputation. A historically low price on the chart might reflect a seller with a poor return policy or high shipping charges - context the chart alone won't tell you.
Crawl Frequency Varies by Tool
Not all price trackers update at the same cadence. Some check prices every few hours; others only once per day or less frequently for niche retailers. A price spike or dip that lasts just a few hours may never appear in the historical record. If precision matters for a specific purchase, it's worth checking when the tool last updated its data for that product.
Reading a Price History Chart Without Overinterpreting It
A price history chart is most useful for answering a narrow question: Is this price lower than it has typically been? It is not a reliable predictor of what the price will be next week. A chart that shows a product rarely dips below $45 gives you reasonable confidence that a $38 listing is meaningful. A chart showing the item frequently selling at $38 tells you a $38 'sale' price is ordinary.
Two patterns to watch for specifically:
- Artificial pre-sale inflation: Some retailers raise prices in the days before a promotional event, so the 'discount' percentage looks larger. A tracker will expose this clearly on the chart.
- Slow drift: Prices on many electronics and household goods trend downward over months as models age. A current price that looks low compared to a year ago may simply reflect normal depreciation, not a special sale.
Understanding seasonal pricing cycles adds another layer. Timing a purchase to avoid overpaying covers how predictable retail calendars interact with price data.
“Price history data is a rearview mirror, not a windshield. It tells you where prices have been, and that context is genuinely useful - but it cannot tell you with certainty where they are going.”
— Consumer Reports, Nonprofit consumer advocacy and product-testing organization
Building Price History Into Your Shopping Routine
Checking a price history chart takes under two minutes and removes guesswork from most 'is this a good deal?' questions. The habit is straightforward: before completing a purchase on any item above a modest threshold you set for yourself, look up the product's price history, identify its typical floor and ceiling, and compare today's price against that range.
If the current price sits near the historical low and you need the item, that's a reasonable signal to buy. If it sits at mid-range and the chart shows regular dips, waiting has been rewarded historically - though no chart guarantees the future. Building a personal price-history habit before you buy walks through a practical routine for making this second nature.
Set a Floor, Not Just an Alert
Rather than alerting on any price drop, set your alert threshold at or below the historical low shown on the chart. This filters out minor fluctuations and focuses your attention on prices that are genuinely unusual. Pair this with a quick seller-quality check before acting on any alert.
This article is for general informational and educational purposes only. It does not constitute financial advice. Readers should evaluate tools and purchasing decisions based on their own circumstances.