
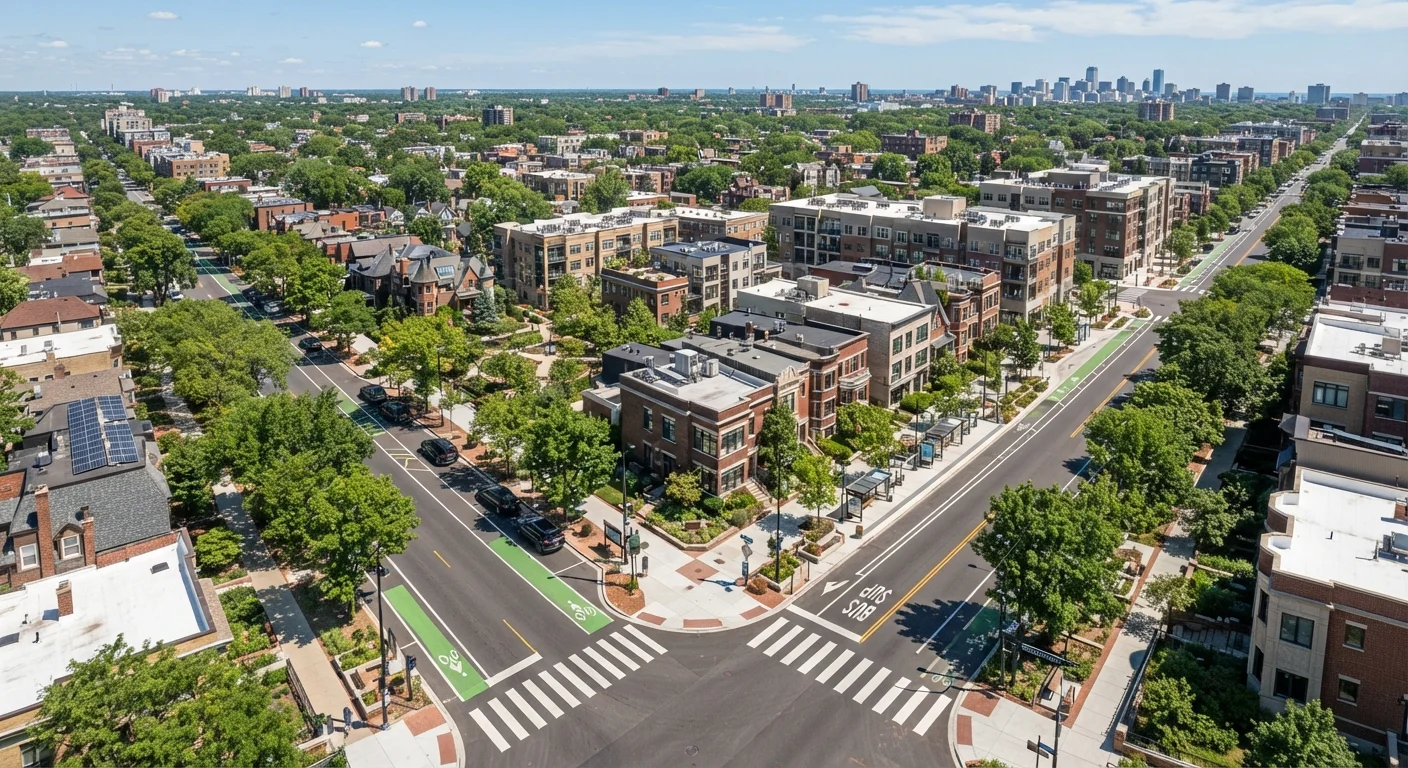
How Each Score Is Calculated
The three scores share the same 0-100 scale but measure fundamentally different things.
Walk Score calculates the distance from an address to amenities across nine categories - grocery stores, restaurants, schools, parks, shopping, coffee shops, banks, entertainment, and bookstores. Distance is weighted: destinations within a quarter mile count fully, while those farther away contribute less. The algorithm also considers intersection density and block length, which reflect how pedestrian-friendly the street grid is. A tight urban grid with short blocks scores higher than a sprawling suburban layout with few crossings.
Transit Score draws on publicly available General Transit Feed Specification (GTFS) data published by transit agencies. It measures the frequency and usefulness of nearby routes - how often they run, and whether they are rail, ferry, or bus. A subway line running every five minutes weighs far more than a bus running once an hour. Crucially, Transit Score measures service quality, not just the presence of a stop.
Bike Score is the most nuanced of the three. It evaluates the availability of bike infrastructure (lanes, paths, and trails), hills and topography, road connectivity, and proximity to destinations reachable within a reasonable cycling distance. A flat city with protected lanes will outscore a hilly area with only painted shoulder markings.
0-100
Shared scale for all three mobility scores
Walk Score, Transit Score, and Bike Score each use the same numerical range, with 100 representing the highest possible access for that mode.
¼ mile
Distance where Walk Score counts destinations fully
Destinations within a quarter mile of an address receive full weight in the Walk Score calculation; contribution decreases at greater distances.
9
Destination categories scored by Walk Score
Grocery stores, restaurants, schools, parks, shopping, coffee, banks, entertainment, and bookstores each factor into the walkability calculation.
What the Scores Don't Tell You
The scores are data-driven approximations, not lived-experience assessments. Several important factors fall outside their methodology.
- Sidewalk condition: A destination may be mapped as reachable, but the path there could be broken, unlit, or absent entirely.
- Personal safety: Walk Score does not incorporate crime data. A high score does not mean a street feels safe to walk at night.
- Seasonal usability: A Bike Score calculated in data makes no distinction between a city with mild winters and one where snow renders cycling impractical for months.
- Business turnover: A restaurant used in the calculation may have closed. Data refreshes lag behind real-world changes.
- Accessibility needs: The scores do not account for wheelchair accessibility, curb cuts, or accessible transit options.
Think of these scores as a starting filter, not a final verdict. They are most useful for comparing several addresses quickly before a deeper investigation. For a fuller picture of what makes a neighborhood worth choosing, see what factors actually define neighborhood quality.
Visit at Different Times of Day
Walk the route from your potential home to a grocery store or transit stop on a weekday morning and again on a weekend afternoon. Foot traffic, noise levels, and how safe a street feels can change dramatically between visits. No score captures this variation.
How to Use These Scores When House Hunting
Used thoughtfully, the three scores can sharpen your search in concrete ways.
Match scores to your lifestyle. If you work from home and rarely use transit, a low Transit Score may be irrelevant - but a high Walk Score for groceries and coffee might matter daily. If you cycle to work, Bike Score becomes a primary filter rather than a footnote.
Compare addresses, not just neighborhoods. Because scores are address-specific, two homes a block apart can differ noticeably. Run the score for the actual property, not the neighborhood average that often appears in general guides.
Use scores alongside other livability measures. Walk Score is one data point in a broader ecosystem of tools. Livability indexes from other organizations measure additional dimensions - air quality, school performance, healthcare access - that the three scores ignore entirely.
Factor in long-term health implications. Walkable neighborhoods are consistently linked to more incidental physical activity. Research generally shows residents of walkable areas walk more, drive less, and report lower rates of certain chronic conditions. How walkability affects health over time explores this evidence in more depth.
Visit in person. A Walk Score of 85 in the data may translate to a pleasant, well-maintained streetscape - or to a congested arterial road with fast food chains but no shade or seating. No score substitutes for a walk around the block at different times of day.
Transportation Costs and Walkability
Households in car-dependent areas typically spend a larger share of income on transportation than those in walkable, transit-rich neighborhoods. When evaluating affordability, factoring in estimated transportation costs alongside housing costs can give a more accurate picture of total monthly expenditure. This is general context - your actual costs will depend on your specific situation.